Using Polar Analytics With Shopify to Improve Data Analysis
At Swanky we are always looking for the best tech to support our work. We recently integrated Polar Analytics into our service, offering it to all our Shopify clients. Read on to find out what Tom Cox, Data & Analytics Manager at Swanky, thinks about this tool and the benefits for retailers.
Written By
Tom Cox

Data is central to all of our services at Swanky and is a key reason for the success of our clients. We always use data to guide our strategy formulation and are therefore always looking for the best tools to support our services.
Most recently, this led us to implement Polar Analytics for all our Growth Accelerator clients. This article will explore the positive experience we and our clients have had using this tool so far.
First, we’ll explore what Polar is, before looking at the tools and benefits it offers.
What is Polar Analytics?
Polar Analytics is primarily a Business Intelligence (BI) and Reporting platform, with API connectors to all the main marketing and ecommerce channels. The tool allows us to quickly connect all data channels and create a centralised view of performance.
In addition, it has its own first-party tracking pixel, which offers transparency on the performance of marketing campaigns, with a variety of attribution models to choose from.
Benefits of Polar Analytics for Shopify stores
1. The Polar pixel
Polar’s first-party pixel can be installed on a Shopify store with a single click. It allows us to independently track traffic: where it’s coming from, how it’s engaging with a site, and how it’s converting and generating revenue.
Why is this important?
Across the ecommerce industry there has been growing discontent with the quality and timeliness of data coming from GA4, leading many to look for alternative solutions. Moreover, GA4’s data attribution model is undocumented, meaning we don’t fully understand how it operates.
In contrast, Polar has given us transparency and allowed us to compare and contrast performance being reported by advertising platforms, GA4 and Polar in a side-by-side view. Alongside this, we can also change attribution models on-the-fly.

Google Ads metrics, showcasing the Polar pixel.
Additionally, we are able to drill down to the customer and order level to understand why Polar has attributed a particular conversion to a channel .
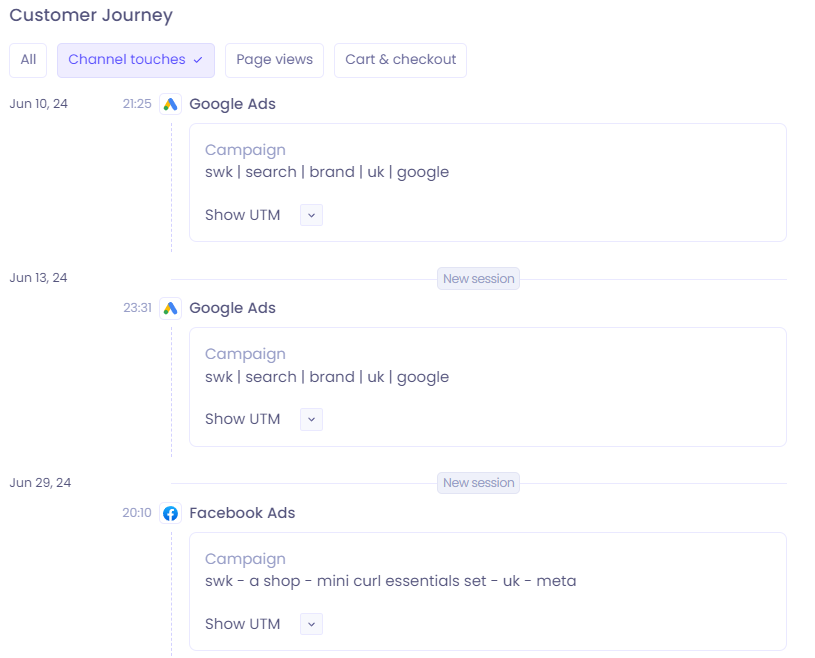
Example of a customer coming to the site through a Google Ads campaign and returning via a Facebook Ad.
How is Swanky making use of this Polar pixel?
We are using Polar’s attribution alongside our ad platform reporting to provide another source of truth when it comes to attribution.
This is proving particularly helpful when looking at longer purchasing journeys that have multiple touchpoints. It gives us better visibility on which campaigns are truly driving value for our clients and which ones should be further improved.
Why do clients love this feature?
Client feedback has been overwhelmingly positive with the implementation of this new tool. In particular, clients enjoy the added assurance and transparency that Polar’s attribution modelling offers, something that isn’t easily visible in GA4 or Shopify.
This empowers our clients to make more informed data-driven decisions, enabling them to invest more heavily in campaigns that are performing well and pull back spend for poorly performing platforms. It’s also made it easier to understand how different marketing platforms are working together to improve overall performance.
2. Attribution models available with Polar Analytics
With the ability to view different attribution models, we can gain a more detailed understanding of campaign performance. At the time of writing, Polar has nine different attributions models to explore:
- U-Shaped – more credit is given to first and last clicks
- Linear – credit is divided equally between all clicks
- Time Decay – credit is given to later clicks
- First Click – 100% of credit is given to the first click
- Last Click – 100% of credit is given to the last click
- Full Impact – credit is shared based on a data-driven model
- Linear Paid – credit is divided equally between all paid clicks
- Full Paid Overlap – 100% of credit is given to the last touchpoint of each paid channel
- Full Paid Overlap plus Facebook views – same as Full Paid Overlap, including conversion from Facebook Views
We’ve written a full article about Swanky’s approach to data attribution for you to learn more about this topic and our methodology.
3. International & multi-store data
Many of our clients are operating globally, across different markets and with multiple Shopify stores. Some are using Shopify Markets, others are implementing our multi-store codebase across expansion stores, and still others are selling through Amazon as well as Shopify. When selling across an array of markets and channels, it can be hard to quickly consolidate data and form a clear understanding of performance.
Polar allows us to import data from all channels, converting currencies and correcting timezones in the process. We can then quickly evaluate performance across all regions.
Moreover, we can connect up multiple Shopify stores, Google Ads accounts and leverage Views to quickly filter by specific regions based on location, campaign or accounts.
This has been a stand out feature for our teams and clients, because it unifies data that can otherwise be siloed in different channels or technologies. We can then identify which markets show opportunity for investment, and which require a different approach.
4. Customisation
Shopify has an excellent suite of reporting options available natively, all accessed from the Shopify admin. Here you have options to filter by sales channel, products and other common dimensions.
However, custom reporting on Shopify can sometimes be limited, with particular restrictions around customer and order parameters, as well as scheduling and exporting reports.
This is where Polar comes in. Using the Create Metric tool, you can quickly create a sales or revenue metric based on a particular tag in Shopify. We have used these dimensions to create filters that can be applied to different views.
Here’s an example to put this into context.
Custom metric example
Let’s say we want to split out ‘D2C online’, ‘D2C recurring subscription’ and ‘B2B orders’ in Shopify – and we want to subtract shipping costs.
First, we can look at D2C online orders.
We pull in the Shopify total sales metric and the Shopify tax metric.
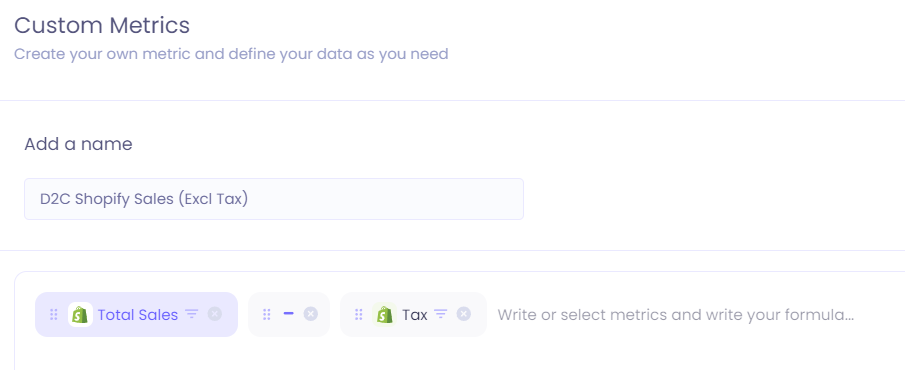
Screenshot showing D2C metric chosen.
We can then filter based on different criteria, such as billing information, customer tags, order tags, order notes (contains a particular key, value combination), discount code being used, etc.
In this example, we choose to include orders where the customer who made the order has a Shopify tag containing B2C.
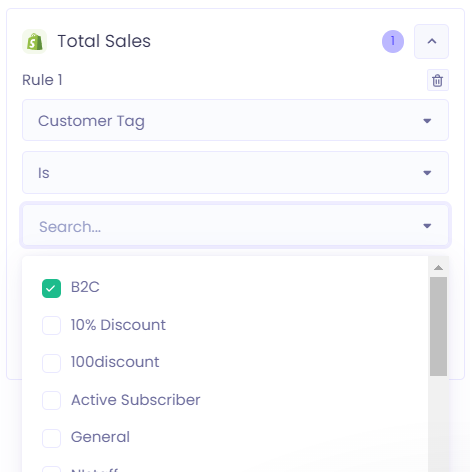
Screenshot showing customer tag chosen.
Once completed, the metric is available for use immediately and we can see it in our main dashboard.
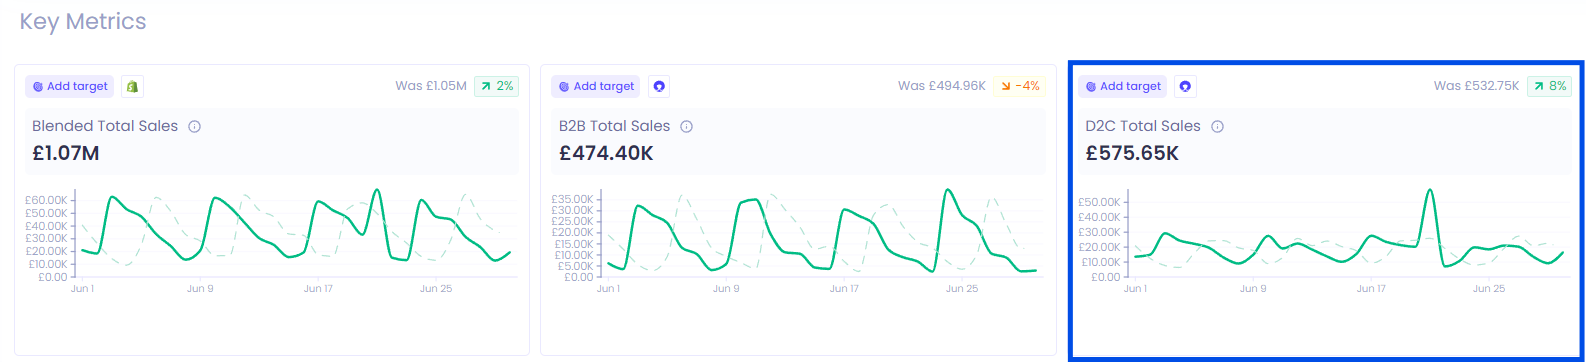
Screenshot showing custom metric in dashboard.
This is really useful when wanting to include or exclude certain orders. For example, you might want to exclude orders from affiliates, or perhaps you want to produce an affiliate report.
It’s worth noting that custom dimensions can also be created using a similar flow.
4. AI analysis
Polar have done an excellent job at gently introducing AI tools into their platform. Its AI support tool enables anyone to jump into the platform and ask a freeform question.
The example below could be used to quickly generate a list of your most valuable customers, which could then be used to create audiences in marketing platforms.
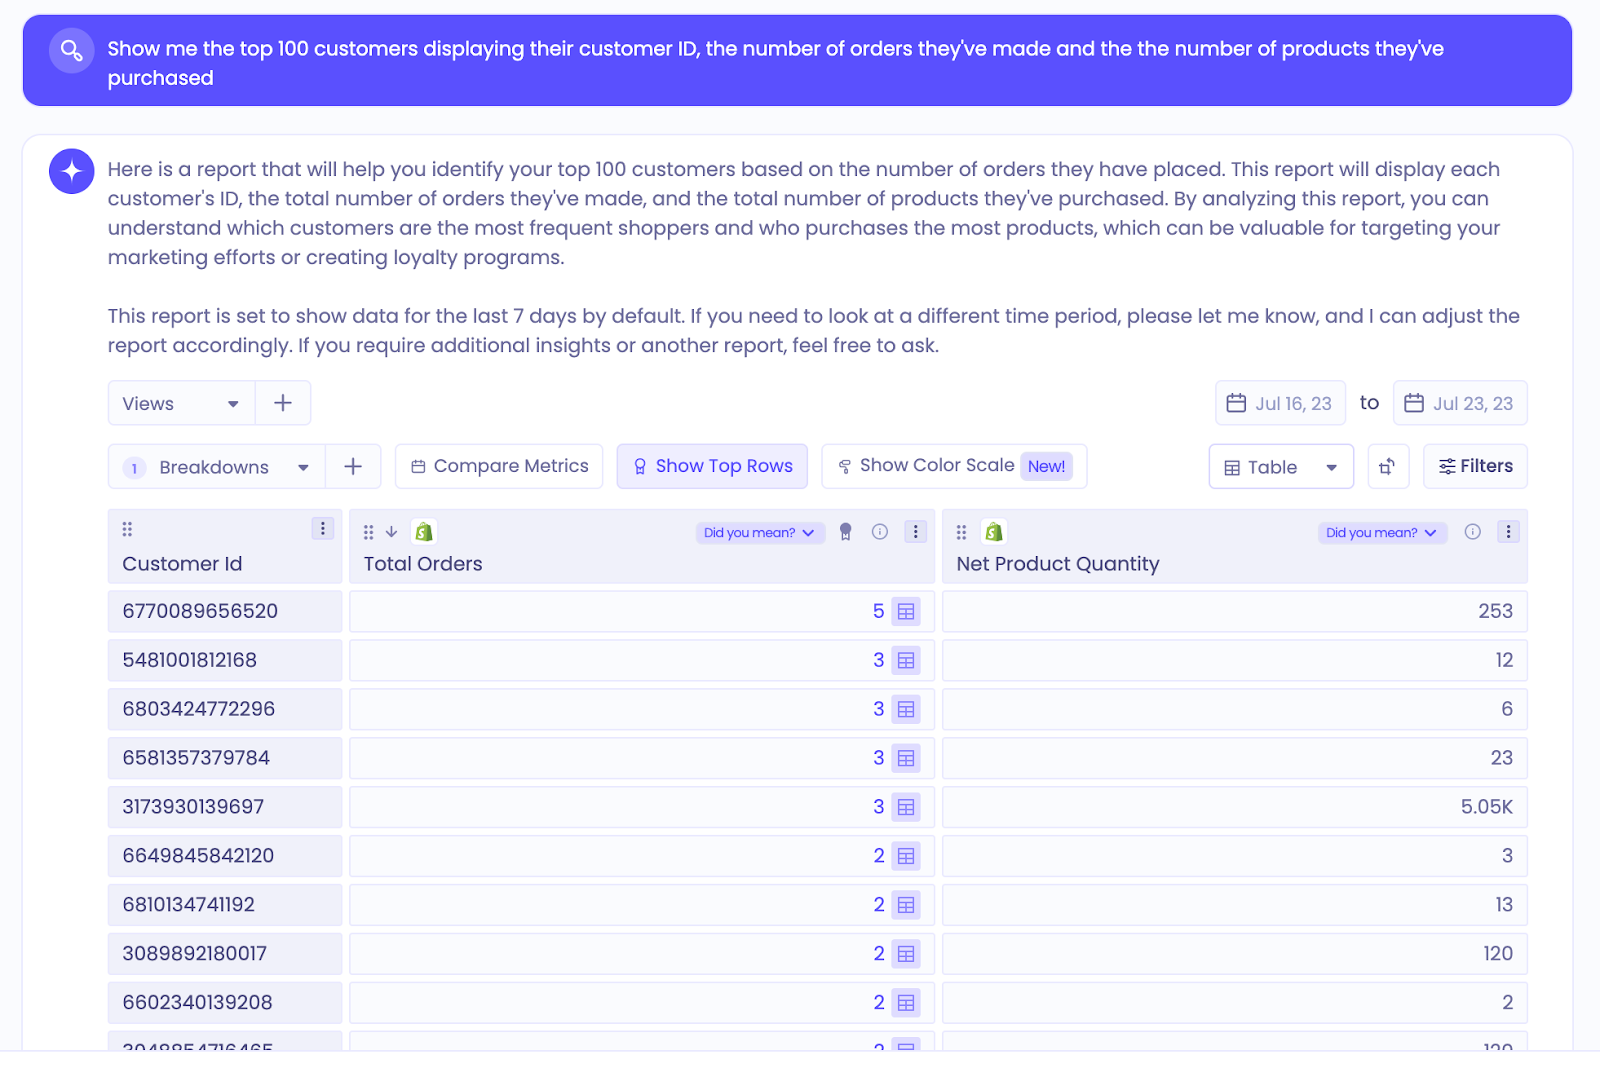 Screenshot of the reply to a freeform question asked of Polar’s AI support.
In addition to report creation, Polar also has a co-pilot tool that will summarise and identify trends in data.
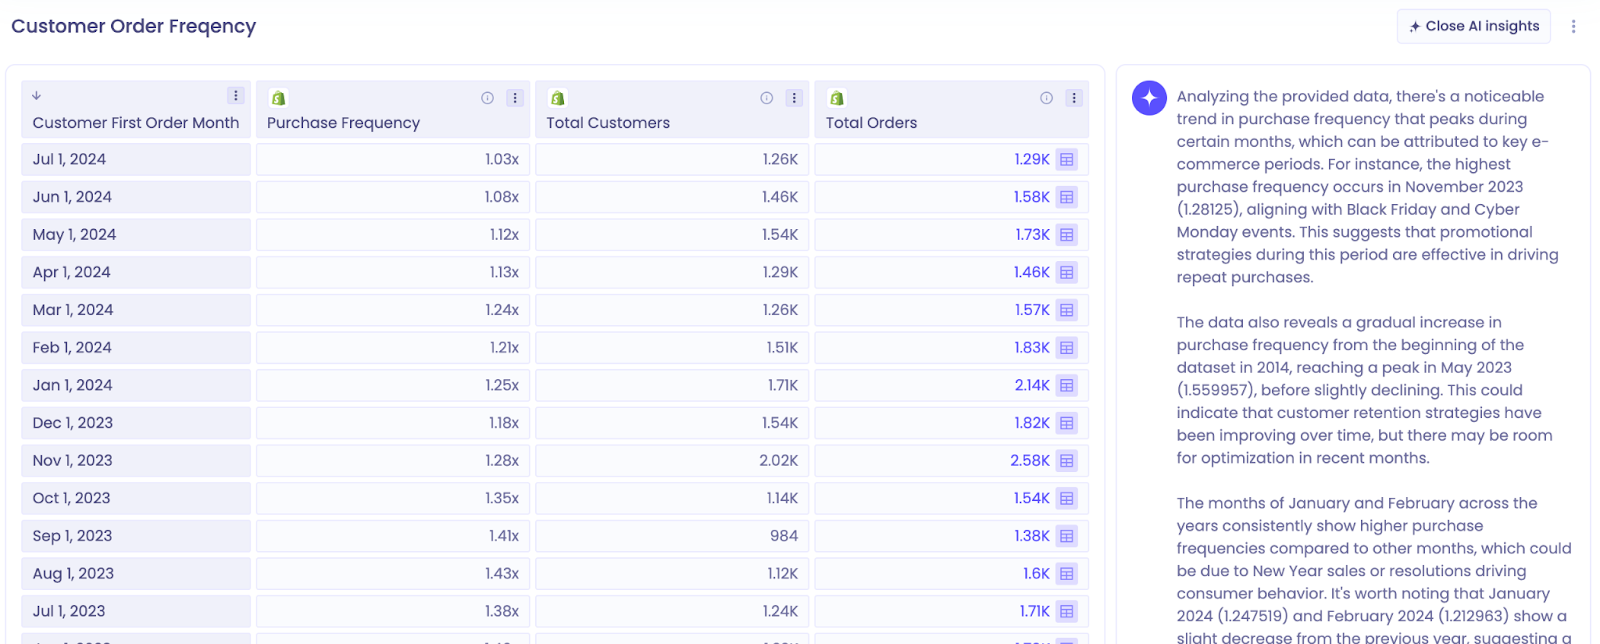
Screenshot of Polar Analytics’ AI-powered co-pilot in use.
5. Report scheduling & alerts
An important aspect of reporting is the ability to distribute and share information with stakeholders in a timely manner. Polar has several different options available for use to help accelerate these processes.
At Swanky, we want everyone in our internal teams to have visibility of the metrics that matter most to our clients; we want them to understand how their work contributes to the success of a brand.
Consequently, we have set up weekly reports that are distributed through our Slack channels, as well as via email. These allow us to check in the previous week’s performance and see what adjustments we need to make to our roadmap.
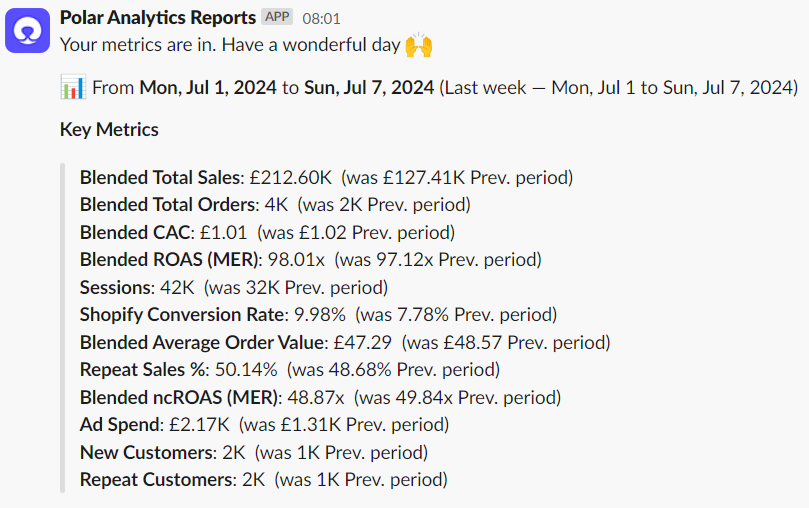
Snapshot of Slack report.
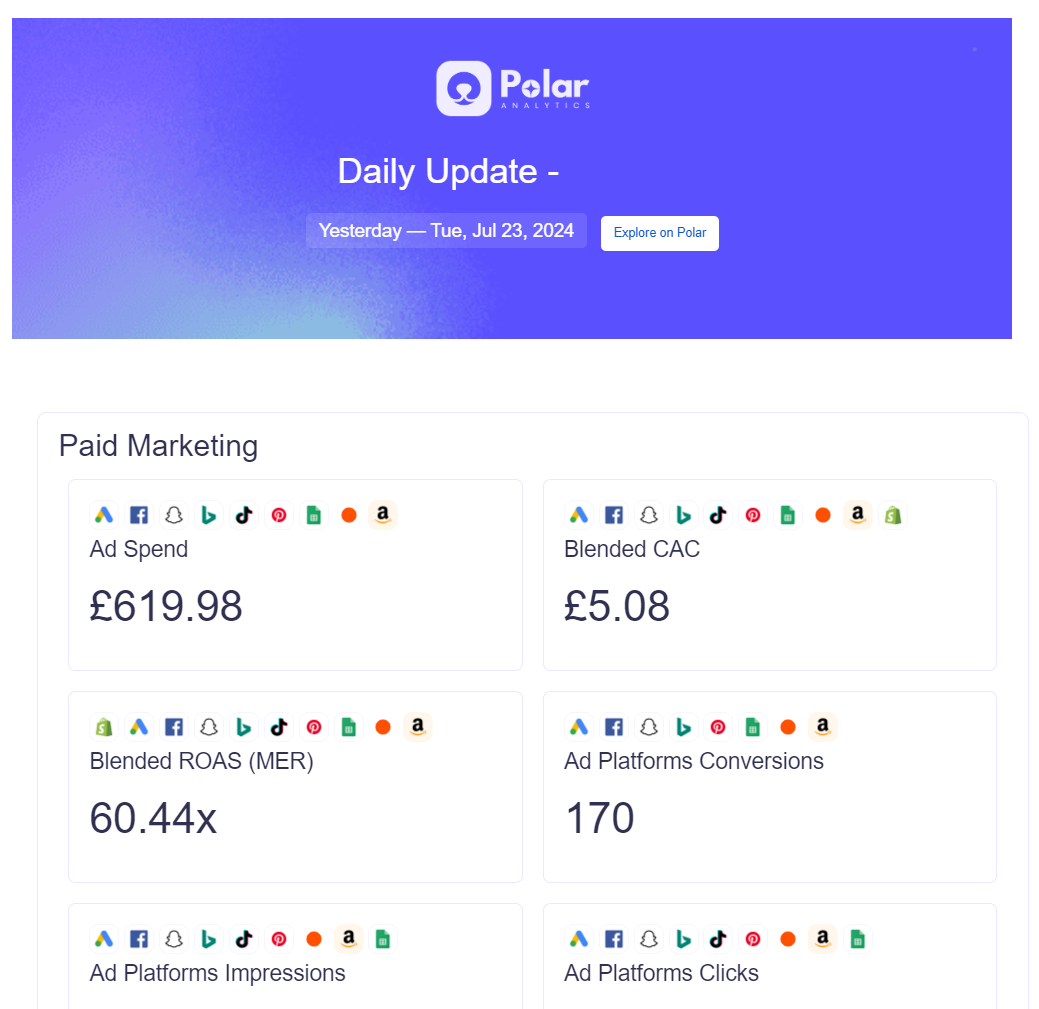
Snapshot of email report.
6. Product reporting
A core part of Polar’s Shopify integration is the enriched product reporting it offers. This gives us and our clients the ability to clearly see which products and variants are selling well and what is due to go out of stock soon.
We can also gather rich insights on product bundling, helping inform decisions about cross-selling and upselling products.
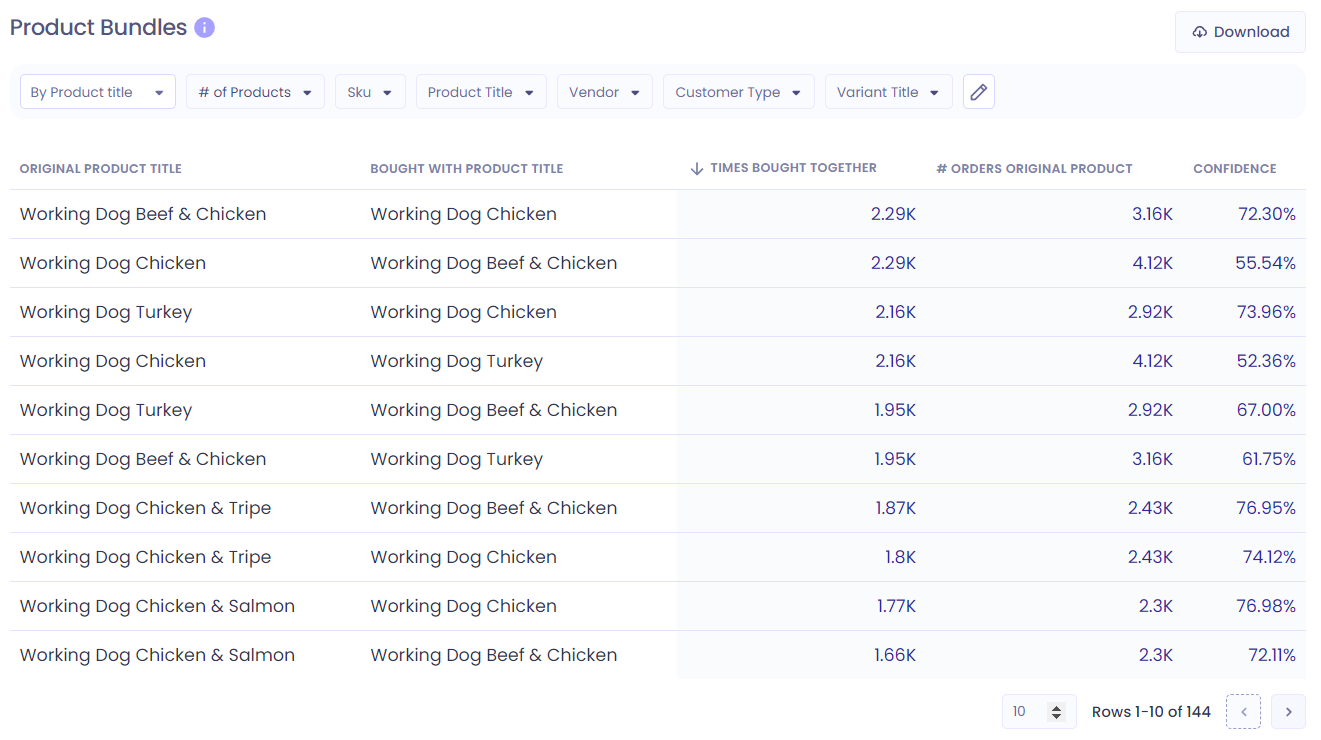
Screenshot showing how frequently products are bundled together.
7. Product support & onboarding
The speed at which we’ve been able to onboard our clients and quickly view their data in one place demonstrates the intuitiveness of Polar’s UI. We’re able to work efficiently in the platform, rapidly switching between screens and analysing vast quantities of data without any delays in the platform. In addition, data is refreshed hourly, meaning we can utilise features such as Alerts to notify us via Slack or email when anomalies in data are detected.
With new product releases and UI improvements occurring frequently, we’re confident that Polar will continue to deliver a great UX for our in-house team, whilst continuing to meet our clients’ evolving needs.
Klaviyo & Polar Analytics
Swanky’s Klaviyo services continue to add value for our clients and, once again, visibility of data is at the centre of this success. Below we look at how Polar has amplified this work further.
Klaviyo Reporting
Polar integrates with Klaviyo, allowing our dedicated Klaviyo team to pull in all the metrics they need to monitor email performance.
We particularly like the ability to see all flows in a single table and quickly compare performance against the previous month.
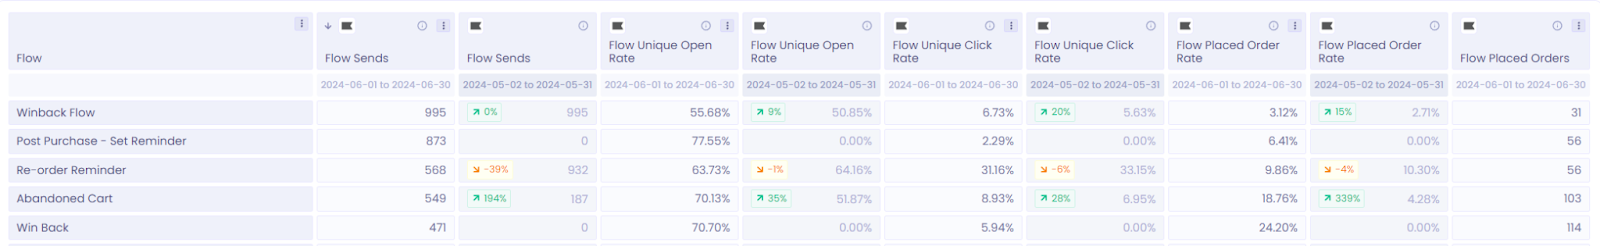
Screenshot of all Klaviyo flows alongside one another.
Klaviyo Flows Enricher
In addition to a robust data connector for Klaviyo, Polar now offers a flow enrichment tool.
Klaviyo captures event data only when a user is logged into Shopify. By integrating with Polar, Klaviyo can utilise data acquired from Polar’s first-party pixel to increase the quantity and quality of data input.
For example, Polar can send up to 70% more abandonment events. Feeding this data into Klaviyo increases the volume of email subscribers included in automated flows, providing a personalised experience for more of your customers. This in turn leads to higher engagement and conversion rates, making the integration a clear benefit for Klaviyo users.
Could Polar Analytics boost your performance too?
In this article we’ve looked at just some of the benefits that a modern and transparent data tool offers. Ultimately, data visibility boosts ecommerce growth because you can quickly and easily adapt your marketing efforts and customer experience.
Are you currently making the most of your data? If you aren’t sure, get in touch today to discuss how a simple audit with our data experts could unlock your next stage of growth.